Availability Management Made Simple with MKController
Summary
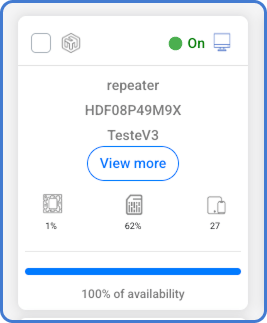
With MKController’s Availability Management, you instantly see whether your MikroTik devices are working as expected. Instead of juggling Netwatch scripts, Dude reports, or SNMP servers, MKController delivers clear visual reports, SLA-ready percentages, and customizable schedules. The result? Transparent uptime proof, proactive detection of micro-failures, and peace of mind — all from the same dashboard you already use to manage your devices.
Why Availability Matters
Every ISP, MSP, and IT admin hears the same customer demand: “We expect 100% uptime.” In practice, anything above 99.99% availability is considered excellent.
Yet proving that number is rarely simple. Devices may fail outside business hours, power blips can go unnoticed, or MikroTik’s own tools may not give the long-term, client-friendly reports you need.
This is where MKController’s built-in availability reporting shines.
MKController Availability Reports
MKController makes availability tracking effortless. Here’s how:
- Always on: Every adopted MikroTik automatically comes with availability monitoring enabled.
- Automatic calculations: MKController measures the exact percentage of time the device was active — no manual setup.
- Clear visualizations: Reports and charts are instantly available, easy to interpret and share.
- Flexible schedules: Customize availability windows per device. If a router should only be online during office hours, MKController calculates uptime only for those periods.
Example: A retail branch open Mon–Fri, 08:00–21:00. MKController’s report only counts those hours, giving you the true availability that matches your SLA.
Customizing Device Schedules
Every business has a different reality. That’s why MKController lets you customize the expected operating hours for each device.
- Go to the Device Information tab, in the device you want to monitor.
- Define the working hours for each day of the week.
- Do not forget to set the correct time zone for the device.

Example:
If the device is in a store that runs Monday to Friday, 08:00–21:00, simply configure those hours. From that point forward, the availability report automatically adapts, considering only the periods when the device is expected to be online.
This ensures your availability metrics match your business model — no more inflated downtime when equipment is intentionally powered off.
Real-World Example: SLA Proof Made Simple
Imagine you’re an MSP managing dozens of MikroTiks across different clients:
-
Without MKController:
You patch together Netwatch scripts, export logs, maybe install Dude or a third-party monitor. At the end of the month, you still struggle to explain uptime in client-friendly terms. -
With MKController:
Open the Availability Report tab → select the device → download a monthly report.
Done. It shows availability percentage, downtime periods, and whether SLA targets (e.g. 99.9%) were met.
This level of clarity is exactly what auditors and clients want.
Why MKController Beats Workarounds
Before MKController, admins tried different methods. Each had its own frustrations:
-
Netwatch (RouterOS built-in)
Users in MikroTik forums complain about false positives and missing history: “Netwatch sometimes shows ISP is down even though it’s not.”
Good for a ping check, but not for SLA proof. -
MikroTik Dude
Loved for its maps and alerts, but limited in exporting uptime history. One admin said: “I want a simple report of uptime per month, but Dude can’t give me that.” -
External monitoring (Nagios, Zabbix, CheckMK, etc.)
Very powerful, but requires maintaining infrastructure, defining OIDs, and custom reporting logic. Often overkill for ISPs or MSPs who just want availability stats.
MKController eliminates those trade-offs. No scripts, no servers, no guesswork. Just plug in your device, and the report is there.
Detecting Problems Before Customers Do
Availability isn’t just about proof — it’s about prevention. MKController helps you:
- Spot power instability or link oscillations before they trigger calls.
- Flag critical devices under 99% uptime.
- Correlate outages across sites using Sites organization to see regional issues.
This proactive visibility means fewer surprises and happier clients.
Conclusion: Visibility, Reliability, Trust
Availability Management in MKController moves you from “we think uptime is fine” to “here’s the report.”
- Visibility: Real-time uptime, downtime, and micro-drops.
- Reliability: Accurate, business-hour aware reports.
- Trust: Clear SLA evidence you can show customers.
Instead of chasing workarounds, MKController gives you availability clarity by default — so you can spend less time proving reliability, and more time delivering it.
Did you not find the information you were looking for? Do you have other questions? Do you want to help us improve the material? Do not hesitate to contact us and seek support from MKController! Click here for any questions.